2.6.1 FAILURE FINDING MAINTENANCE
Maintenance
tasks focused on identifying failures are used to uncover equipment
malfunctions that go unnoticed during regular crew operations, such as
concealed defects. Since these issues are hidden, proper maintenance is
crucial. Otherwise, a subsequent failure and its consequences must transpire
before the equipment problem becomes evident. For instance, the inability of a
backup electrical generator to start upon power loss might only become apparent
when the primary generator fails, causing a power outage. Unfortunately, traditional
condition monitoring or scheduled maintenance tasks are often inadequate for
managing hidden failures. Instead, failure-detection maintenance tasks, which
usually involve functional equipment testing, are employed to ensure the
equipment's readiness to perform its designated function(s) when needed.
2.6.1.1 HIDDEN
FAILURES – STATISTICS
A
failure-finding task aims to minimise the risk of multiple failures to an
acceptable level by controlling the occurrence rate of such failures. For
example, when assuming that multiple failures can only arise from the
simultaneous combination of a specific initiating event and the unavailability
of a safety or backup system, the occurrence frequency of multiple failures can
be described using the following formula:

Maintaining
equipment unavailability below the level required to keep the multiple failure
occurrence frequency sufficiently low is crucial, ensuring an acceptable
failure risk to achieve an acceptable failure occurrence frequency. For
instance, if a specific event's acceptable multiple failure occurrence frequency is 0.01 per year, the initiating event's failure frequency
(e.g.,
Failure-finding
tasks are efficient in addressing hidden failures because they either (1)
verify the equipment's functionality or (2) enable the detection of equipment
failure, necessitating repairs. After conducting the task, the unavailability
of the safety or backup system is effectively "reset" to zero (or
close to zero). As time passes, the unavailability increases until the
equipment fails or undergoes retesting. The failure rate remains constant,
implying that the failure probability increases linearly (or nearly linearly
over most reasonable periods) with a slope equal to the failure rate (i.e., the
failure probability is the product of the failure rate and elapsed time). The
impact of failure-finding tasks can be seen in the below figure.

2.6.1.2
APPLICABILITY AND EFFECTIVENESS OF FAILURE-FINDING TASK
For a
failure-finding work to be deemed effective, the following criteria must be
met:
·
There should be no available or
cost-efficient condition-monitoring or planned maintenance task capable of
detecting or preventing the failure.
·
The task must be technically viable to
execute. Performing at the necessary interval should be feasible without
disrupting a stable system.
·
The task must reduce the failure
probability (and thereby the risk) to an acceptable level. The tasks must be
conducted at intervals that ensure the probability of multiple failures
maintains an acceptable risk level. Risk acceptance criteria should be established
and documented.
·
The task must not elevate the risk of
multiple failures (e.g., when testing a relief valve, overpressure should not
be generated without the relief valve is operational).
·
The task must ensure that entire
protective systems are tested, not individual components.
·
The task must be cost-effective. Over
time, the expense of performing the task should be lower than the total cost
associated with the consequences of failure.
2.6.1.3 TASK
INTERVAL FOR DETERMINING FAILURE-FINDING MAINTENANCE
The
interval for failure-finding tasks can be established through the following:
·
Mathematical approaches employing
reliability equations, or
·
Utilising general guidelines designed to
maintain an acceptable risk level.
Regardless
of the method employed, the primary objective is to ensure that the
unavailability of a safety or backup system remains low enough so that the
frequency of multiple failure occurrences is adequately reduced to achieve an
acceptable risk level. An acceptable occurrence frequency must be defined for a
specific consequence of multiple failures. For instance, a 0.01 per year
occurrence frequency may be acceptable for a €1 million operational loss, while
a 0.1 per year frequency could be suitable for a $100,000 operational loss. In
both scenarios, the risk is equivalent (€10,000 per year).
2.6.1.3.1 FAILURE-FINDING TASK INTERVAL - MATHEMATICAL DETERMINATION
The
intervals for failure-finding tasks addressing the highest-risk hidden failures
often necessitate mathematical determination; this is typically achieved by
assuming the hidden failure is random and, thus, best modelled using the
exponential distribution. This assumption is generally valid for the following
reasons:
·
If the failure exhibits a wear-in failure
characteristic, a one-time change or a condition-monitoring task is usually
employed to manage the failure.
·
If the failure demonstrates a wear-out
failure characteristic, a condition-monitoring or planned maintenance task
should be applied to manage the failure.
To establish a failure-finding task interval, the equations for the
frequency of multiple failures and the unavailability of the hidden failure are
combined as follows:

The
subsequent additional assumptions are frequently accurate and will result in
simplification:
·
The failure distribution is exponential.
·
The product of the conditional failure
rate and the test interval time (λ × test interval) is less than 0.1.
·
The time required to perform a
failure-finding task is short compared to the system's availability duration.
·
The time needed to conduct a system
repair is short compared to the system's availability duration.
·
Multiple failures can only arise from the
simultaneous combination of the specified initiating event and the
unavailability of the backup or safety system.

2.6.1.3.2
USING GUIDELINES TO DETERMINE THE FAILURE-FINDING TASK INTERVAL
Guidelines
are established and documented to determine the failure-finding task
interval. This process typically involves the following steps:
·
Setting up criteria for determining the
required unavailability of the hidden failure, considering the risk associated
with the hidden failure
·
Estimating the Mean Time To Failure
(MTTF) of the hidden failure
·
Identifying the test interval using a
table derived from the equation ( T )
|
Risk of Hidden Failure |
Unavailability Required |
|
Very High |
< 0.0001 |
|
High |
> 0.0001 to 0.001 |
|
Moderate |
> 0.001 to 0.01 |
|
Low |
> 0.01 to 0.05 |
Failure-finding -
Interval Rules – Example
|
Unavailability Required |
Failure-finding Interval (as % of MTTF) |
|
0.0001 |
0.02 |
|
0.001 |
0.2 |
|
0.01 |
2 |
|
0.05 |
10 |
Failure-finding -
Interval Based on MTTF – Example
When using the guideline-based approach, users should be cognizant of the assumptions made while developing the rules and task intervals. Confirming the validity of these assumptions in the context of the specific system or equipment being assessed is essential. By doing so, users can ensure that the determined
task intervals accurately reflect real-world conditions and contribute to an
effective failure management strategy.
2.6.2 RISKS
CONSIDERATION
Risk
can be divided into two components: the frequency of loss events and the
severity of their consequences.
Frequency,
often expressed in loss events per year, can be determined using historical
data (if many events have occurred) or calculated through risk analysis tools
(if limited data records exist).
Consequences
can be represented as a combination of a loss event's impact on various
aspects, such as:
·
Capital investment: Damage to equipment and cost of repair
·
Community: Effects on the public
·
Directional
control: Total loss or diminished manoeuvrability
·
Explosion or fire: Damage to equipment and/or the vessel
·
Loss of containment: Quantity of harmful substances released into the environment
(including cleanup costs)
·
Operations: Loss of hire, outage time for functions like drilling, position
mooring (station keeping), hydrocarbon production and processing, loading or
unloading operations
·
Propulsion: Complete loss or reduced propulsive capability
·
Safety: Number of individuals affected (injuries or fatalities)
After
identifying the risk associated with a loss event, ship designers, operators,
insurers, and regulators should implement preventive and/or mitigative measures
to reduce the risk to an acceptable level.
The
operating modes of a vessel or marine structure, such as ocean transit, cargo
discharge, and others, may be associated with different types of loss events.
As a result, identifying the operating mode is a crucial initial step in
addressing risks for marine vessels and structures. By understanding the
specific operating mode, appropriate risk mitigation measures can be tailored
to the unique challenges presented in each situation.
Operating
modes represent the various contexts and environments in which the vessel
functions. Therefore, hazards can be identified based on these operating modes.
Initiating events are specific equipment failures, human errors, or external
occurrences (e.g., lightning strikes) that could lead to undesired events.
Preventative measures consist of engineered safeguards (e.g., alarms) or
management systems (e.g., personnel training) designed to prevent an initiating
event from escalating into an undesired event. Undesired events are the
immediate consequences of an initiating event and hazard affecting the vessel,
such as collisions or allisions. By recognising these factors and their
interplay, appropriate risk mitigation strategies can be developed for each
operating mode.

FIGURE 1 The General Risk Model
2.6.2.1 VESSELS AND
INNATE RISKS
Loss
events associated with each operating mode can be comprehensively postulated.
Many loss events are already well-known and implicitly or explicitly identified
in classification society rules and International Maritime Organization (IMO)
regulations. These typically include events such as structural failure, loss of
stability, loss of propulsion, and fire. Take "loss of propulsion" as
an example. Preventative measures must be implemented to ensure propulsion
machinery reliability, thus minimising the risk of propulsion loss.
Additionally, mitigative measures should be in place to address potential
consequences like collision, grounding, or pollution in the event of propulsion
loss. The extent of preventative and mitigative measures depends on the risk
level and acceptable risk threshold.
Until
now, classification society rules and IMO regulations have primarily focused on
risk reduction for vessels through hardware design, facility provision, and
in-service inspection. However, some areas traditionally have not been
explicitly covered, such as:
·
Specificity regarding the vessel's
operating modes
·
Quantification of risk levels and
definition of acceptable risk criteria
·
Inclusion of operational measures (e.g.,
safety management and crew training) as tools to reduce risks, especially in
measures to mitigate consequences
·
Emphasis on maintenance as a means of preventing
loss events
Risk
acceptance criteria are discussed in general terms in the following subsection.
2.6.2.2 RISK
CHARACTERISATION
A risk
matrix is an effective method for characterising the risk of loss events. It
consists of a grid with cells corresponding to defined consequence (severity)
and frequency categories, where loss events can be placed. The consequence and
frequency categories are designed to be broad enough to quickly determine the appropriate risk cell for a loss event yet sufficiently narrow to offer
varying degrees of resolution for decision-making. In addition, frequency and
consequence levels on a risk matrix are often graduated by order of magnitude,
providing a clear visual representation of the risks associated with different
events; this allows stakeholders to prioritise their risk management efforts
based on each event's potential impact and likelihood.
Severity
levels can be defined for various types of loss consequences based on the list
of examples. Table 1 showcases five (5) consequences (directional control,
propulsion, loss of containment, fire/explosion, and safety) and outlines four
severity levels for each consequence. Before the risk analysis, an appropriate
severity level term for the consequence should be chosen and defined. For each
severity level, several example descriptors are listed. Some descriptors are
repeated between adjacent severity levels. Some studies use numerals (e.g., 1,
2, 3, 4) to represent the severity levels.
The
descriptor chosen to describe a particular severity level may vary between
analyses. For instance, one analysis might choose the descriptors
"hazardous" and "critical" to describe the two highest
severity levels, while another analysis might opt for "critical" and
"catastrophic." This flexibility allows organisations to adapt the
severity levels to their needs and better understand the potential consequences
of different loss events.
Frequency
categories are typically expressed in units of events per year. Sometimes, it
is challenging to comprehend the smaller frequency categories (e.g., Remote:
0.001 events per year to 0.01 events per year, or from 1 event every 1,000
years to 1 event every 100 years). However, these small frequencies can be
better understood when considering multiple vessels over extended periods. For
example, a loss event that has occurred twice across a fleet of 100 vessels
over the last 20 years corresponds to a frequency of 0.001 events per year.
The
risk-based decision-making aspect of a risk matrix is observed along the lines
of constant risk. Each cell in the risk matrix corresponds to a defined risk
level. Cells with similar risk levels are grouped to form a continuous risk
line. All cells in a risk matrix should be categorised into relevant lines of
constant risk. Risk-based action levels to address the loss event are based on
the risk level represented by the line of constant risk. Generally, the actions
necessary to address loss events in each risk level are predefined.
Using a
risk matrix enables decision-makers to prioritise actions and allocate
resources based on the risk levels associated with different loss events. By
grouping events with similar risk levels and defining actions to address these
events, organisations can manage risks more effectively and make informed
decisions on how to best mitigate potential consequences.
Once
the risk of the loss event has been identified using the risk matrix, a risk
reduction action consistent with the required action level should be chosen.
Typically, maintenance tasks such as condition monitoring and planned
maintenance will primarily reduce the frequency of occurrence of a loss event. At the same time, equipment redesign actions and one-time changes may decrease both the
frequency and consequence. Central to the risk-based task selection process is
evaluating the task's impact on the loss event. The ultimate objective
should be to select an efficient, feasible task to decrease the risk level of
the loss event to an acceptable level of risk (e.g., low risk or medium risk).
By
carefully assessing the potential risk reduction actions and their impact on
the loss event, decision-makers can prioritise and implement the most suitable
measures. This ensures that resources are allocated effectively and efforts
are focused on tasks that will provide the most significant risk reduction. As
a result, organisations can better manage risks associated with their
operations and minimise the likelihood and consequences of loss events, thereby
achieving a safer and more reliable operational environment.


FIGURE 3 Risk Matrix and Example Consequence
(Severity) Categories
2.6.3 RCM ANALYSIS – EXECUTION AND DOCUMENTATION
The
following procedures guide RCM (Reliability Centered Maintenance) analyses. RCM
analyses should be performed systematically, following a step-by-step process.
The essential elements of an RCM analysis process include the following:
·
Identify operating
modes and corresponding operating contexts:
Determine the different operating modes and their specific contexts, such as
regular operation, standby, or emergency modes, and the related environmental
and operational conditions.
·
Define vessel
systems: Break down the vessel into various systems and
subsystems, such as propulsion, power generation, and safety systems, for
more detailed analysis.
·
Develop system
block diagrams and identify functions: Create block
diagrams for each system, illustrating the relationships between components and
subsystems. Identify each system's primary and secondary functions, considering
their intended purposes and goals.
·
Identify functional
failures: Determine potential failures that can prevent a
system from performing its intended functions, such as equipment malfunctions,
human errors, or external factors.
·
Conduct a Failure
Modes, Effects, and Criticality Analysis (FMECA): Analyse each potential failure mode and its effects on the system,
considering factors such as frequency, severity, and detectability. In
addition, the criticality of each failure mode should be assessed to prioritise risk
management efforts.
·
Select a failure
management strategy: Choose an appropriate strategy for
managing each identified failure mode, including preventive maintenance,
condition monitoring, or redesigning components. The selected strategy should
minimise the overall risk and maximise the system's reliability.
·
Determine spare
parts holdings: Identify the necessary parts and
their required quantities to support the chosen maintenance strategies,
considering lead times, costs, and storage constraints.
·
Document the
analysis: Compile and document the RCM analysis process,
including the identified failure modes, chosen maintenance strategies, and
spare parts holdings, to support effective implementation and continuous
improvement.
2.6.3.1 DEFINING SYSTEMS
Each
system must be accurately defined to conduct an RCM analysis effectively and comprehensively. This process involves:
1.
Defining the operating characteristics
for the ship as a whole and then for each system: Begin by outlining the
overall operational characteristics of the vessel, considering factors such as
its intended use, operating environment, and mission requirements. Next, define
each system's operating characteristics, considering aspects like
performance criteria, operating modes, and specific environmental conditions.
2.
Partitioning the vessel into functional
groups, systems, and equipment items: Divide the vessel into distinct
functional groups based on their overall purpose and interdependence. For
example, functional groups may include propulsion, navigation, safety, and
communication systems. Further partition these functional groups into specific
systems, such as engines, generators, or fire suppression systems, and then
break them down into individual equipment items or components. This
hierarchical structure helps clearly define each system's boundaries and
operational intent subject to RCM analysis.
By
following these steps, you can ensure a detailed and organised approach to
defining each system for RCM analysis. This accurate definition is crucial for
identifying potential failure modes, understanding their effects, and
determining appropriate maintenance strategies to minimise risks and maximise
system reliability.
2.6.3.2 DEFINING
SHIP OPERATING CHARACTERISTICS
Defining
the operating characteristics of a vessel is crucial for making informed
decisions regarding the RCM failure management strategy. Incomplete or
inaccurately defined operating characteristics can lead to an inappropriate
failure management strategy. To properly define the operating characteristics,
follow these steps:
·
Identify the various operating modes for
the vessel: List the different operating modes the vessel goes
through during its service life. These may include transit, loading and
unloading, anchoring, maintenance, and emergency response. Each operating mode
has specific requirements and challenges that must be considered.
·
Define the operating context for each
functional group based on the operating modes: After identifying the operating
modes, use them to define the operating context for each functional group. The
operating context consists of the conditions and requirements the
functional group must meet while operating within a specific mode. For example,
the propulsion system's operating context in transit mode might include speed, fuel efficiency, and noise reduction requirements. In contrast, its context
in maintenance mode could involve accessibility, ease of maintenance, and
safety considerations.

FIGURE 1 RCM Analysis
Diagram
2.6.3.2.1 OPERATING MODE
An
operating mode for a vessel or marine structure represents its current
operational state. Each operating mode affects how the ship's systems and
machinery should be operated, guiding the formulation of operating contexts for
distinct functional groups. The following are some standard operating modes for
ships:
•
Normal seagoing conditions at full speed
•
Maximum allowed operating speed in
crowded waters
•
Manoeuvring next to a dock or another
ship
•
Cargo handling operations
The
following example operating modes are typical for mobile offshore drilling
units and offshore oil and gas production facilities:
•
Drilling operations
•
Position mooring or station keeping
•
Relocation/Towing
•
Hydrocarbon production and processing
•
Import and export functions
2.6.3.2.2 OPERATING CONTEXT
The
operating context of a functional group refers to the conditions under which
the system is expected to operate. It should provide a comprehensive
description of the following:
•
The physical environment where the
functional group operates
•
A detailed explanation of how the
functional group is used
•
The specified performance capabilities of
the functional group, as well as the required performance of any additional
functional groups within which the functional group is integrated
Some
essential factors to consider when developing the operating context for a
functional group include:
•
Serial redundancy applies to configurations with an identical standby system/equipment
to support an operating functional group. If the operating system fails, the
standby system is activated. The operating contexts for the running and standby
systems/equipment are distinct. For instance, a functional failure in the
operating system/equipment is likely to be apparent, while one in the standby
system/equipment is likely to be hidden.
•
Parallel redundancy pertains to systems/equipment operating simultaneously. Each system
can meet the total demand. If a functional failure occurs in one
system/equipment, the remaining systems/equipment continue operating at a
higher capacity. In some cases, standby systems/equipment may also be
available.
•
Performance and
quality standards: Systems/equipment may need to perform at
a specific level or provide a service meeting particular quality criteria
(e.g., compressed air supplied at a specified quantity, pressure, temperature
range, and humidity limit).
•
Environmental
standards: As required by international, national, and
local laws and regulations (e.g., for an engine emission standard, the
operating context should consider a functional group's impact or potential
impact on the environment).
•
Safety standards: The operating context should specify any hazards that might be
present and the safeguards required to protect the crew.
•
Shift arrangements: It is assumed that the propulsion machinery operates continuously for
ocean-going vessels, except when the vessel is docked. However, the ship's
service electrical power system operates continuously. Therefore, system
configurations and maintenance strategies must be carefully developed to ensure
system availability.
2.6.3.2.3 VESSELS OPERATING CONTEXTS - DEVELOPMENT
Operating
contexts should be developed with varying degrees of detail at each level. An
operating context statement should be written for each level of functional
breakdown, expanding upon the context provided at the preceding level. As the
focus shifts to the systems and equipment that comprise the functional group at
the lower levels of the functional breakdown, more detail is included in the
operating context statement.
Specific
performance parameters are crucial for defining functions for the functional
group and determining what constitutes a failure and the effects that such
failures will have on individual equipment performance, overall system
operation, and, ultimately, the vessel's roles.
•
Vessel level: Operating contexts should
first be developed for the vessel as a whole, typically with a focus on the
vessel type; this includes a physical description of the vessel, the vessel
type, the cargoes to be carried, performance standards (speed, manoeuvrability,
fuel capacity and consumption, etc.), and cargo handling capabilities.
Statements should address the primary roles (e.g., transporting cargo from
point A to point B within a specific time frame, cargo preservation), secondary
roles (e.g., crew habitability), and safety and environmental roles of the
vessel.
•
Functional group
level: Using the vessel-level operating context,
develop an operating context for each functional group level (e.g., machinery
and utilities, propulsion functional group). The operating contexts at a given
functional group level must encompass all operational characteristics to define
the context for the next highest level. For example, the operating contexts for
propulsion, manoeuvring, electrical, vessel service, and navigation and
communication functional groups should include all operating characteristics in
the machinery and utilities functional groups. Additionally, an operating
context must be developed for each vessel's operating mode.


TABLE(s)
1 & 2 Example Operating Modes and Operating Context
2.6.3.3 DIVIDING SYSTEMS
Due to a vessel's complexity, which comprises numerous intricate systems and subsystems, it is beneficial to categorise it into functional groups.
These functional groups can then be divided into specific systems,
subsystems, equipment items, and individual components. This approach allows
for a more structured and manageable understanding of the vessel's overall
design and operation.
2.6.3.3.1 DIVIDING A VESSEL INTO FUNCTIONAL GROUPS
Dividing
a vessel into functional groups is done using a top-down approach. For most
vessels, the top level consists of the following primary functional groups:
•
Hull
•
Machinery and utilities
•
Cargo handling
In most
instances, it is necessary to further divide these high-level functional groups to identify major systems for analysis. For example, machinery and utilities
can be subdivided into the following functional groups:
•
Propulsion functional group
•
Manoeuvring functional group
•
Electrical functional group
•
Ship service functional group (e.g.,
bilge, ballast, firefighting, steam)
•
Navigation and communication functional
group
Each
functional group should be divided using a top-down approach until a level is
reached where functions are associated with distinct physical units, such as
individual systems or equipment items; this is sometimes called the level of
indenture. The indenture level is crucial as it significantly influences the
time and effort needed to conduct a thorough analysis. An analysis performed at
too high a level may be overly superficial, while one conducted at too low a
level may become excessively complex.
The
level of indenture will vary depending on a system's complexity. Highly complex
systems with numerous failure modes will typically be analysed at lower levels.
The level of indenture should allow for the identification of the following
elements within the functional group:
•
Physical boundaries
•
Functions and functional failures
•
Discrete equipment items
2.6.3.3.2 DIVIDING A FUNCTIONAL GROUP INTO EQUIPMENT ITEMS
Upon
achieving an appropriate level of partitioning for functional groups, each
functional group should be further divided into specific equipment items. One
or two levels of indenture might be necessary to adequately separate a functional group into equipment items. The chosen level of indenture for equipment
items should meet the following criteria:
•
The equipment can be identified for its
contribution to the overall functions of the functional group.
•
The equipment can be identified for its
failure modes.
•
The equipment represents the most
convenient physical unit for specifying maintenance tasks.

2.6.3.3.3 SELECTION OF FUNCTIONAL GROUPS FOR ANALYSIS
Establishing
a priority order to analyse functional groups might be necessary, allowing
resources to be utilised more effectively. Generally, one of the following
methods is employed to choose groups for analysis:
•
Engineering
judgment: This method depends on the undocumented
experience of subject matter experts in selecting the group. Typically, when choosing
a group, a team will subjectively consider factors such as the number of
failures that have occurred, the amount of maintenance resources, the potential
for performance improvement, and the possibility of reducing costly downtime
maintenance (e.g., dry-docking maintenance). After determining the selection
and priorities, the team should document the reasoning behind their decision.
•
Simple analytical
approaches: A more analytical method for selecting
functional groups involves using simple tools like Pareto analysis and relative
ranking. These tools offer the selection team a structured methodology for
ranking the various factors considered during the selection process. When using
Pareto analysis, the team collects data on each considered factor. For
instance, if the number of failures is essential, the team would gather failure
data for each group and then rank each group based on the number of failures.
The team develops a scoring system for each factor when using relative ranking.
The scores are then tabulated and evaluated to rank the groups.
•
Risk assessment: The most comprehensive approach is to perform a risk assessment or
use an available risk assessment to select and rank functional groups. Whether
the risk assessment is a detailed quantitative analysis or a high-level
profiling analysis (used for enterprise risk management), the risk assessment
data can identify groups with unacceptable risk and those with the highest
risk. The unacceptable risk data can determine if further detailed analysis,
such as RCM analysis, is warranted. The group risk ranking can then be used to
prioritise groups for analysis (e.g., groups with the highest risk are analysed
first). Additionally, the risk assessment should be reviewed to determine if
equipment failures can be affected by improved maintenance and if these
failures are significant contributors to the risk. For example, when reviewing
a group's risk assessment, it might be discovered that the major risk
contributor is operational errors. In this case, an RCM analysis might not be
the best method to reduce the risk. However, the highest-risk groups where
equipment failures are major risk contributors are suitable candidates for RCM
analysis.
Regardless
of the approach used to select groups, the following considerations should be
taken into account:
•
The expected cost savings over the
projected remaining life of the equipment should be balanced against the cost
of the analysis.
•
The human resources required to conduct
each analysis must be identified, and their availability must be ascertained.
2.6.3.4 DEFINING
FUNCTIONS AND FUNCTIONAL FAILURES
After establishing
the operating mode for the vessel and the operating context for a functional
group, the RCM analysis team uses this information to determine the necessary
functions for the functional group to operate successfully, ensuring all
relevant vessel functions are maintained. Considering the applicable operating
modes when defining functions is crucial, as functions can vary with different
operating modes. Furthermore, identifying all functions is essential, as
failing can lead to overlooking critical failures (e.g., those affecting system
and vessel performance).
Once the functions
are defined, functional failures (e.g., various loss functions that can occur
due to failures) are identified. Functional failures can represent a total loss
of function (e.g., providing no compressed air) or a partial loss of function
(e.g., providing compressed air at reduced pressure and flow). The following
paragraphs explain more about identifying functions and functional failures.
1.
Identifying functions:
Begin by listing the required functions for each functional group, considering
the operating context and mode. These functions may include primary functions
(directly related to the main purpose of the functional group), secondary
functions (supporting the primary functions), and safety or environmental
functions (relating to safety and environmental requirements).
2.
Identifying functional failures:
For each identified function, determine the potential functional failures that
could occur. These failures can be total (the complete loss of a function) or
partial (a reduction in the function's effectiveness or efficiency). It is
important to consider different operating modes and contexts and the potential
impact of these failures on the overall system and vessel performance.
2.6.3.4.1 IDENTIFYING FUNCTIONS FOR A FUNCTIONAL GROUP
After completing
the operating characteristics and partitioning, the subsequent task involves
identifying the functions associated with the chosen functional group and its
associated equipment. These functions are determined by considering the
operating context of the functional group and the equipment included within it.
Therefore, it is essential to state what the functional group must provide or
do to ensure proper vessel operation in the given operating mode rather than
how individual equipment items operate to ensure comprehensive identification
and definition of all functions. For instance, a propulsion group function
could be "providing X horsepower at Y RPM to the propeller" despite
the engine's potential to produce more horsepower and operate at a higher RPM.
Developing a
functional block diagram is one approach to identifying functions. This diagram
represents the system operation in a graphical format, comprising three main
components. Firstly, the inputs (e.g., raw materials, energy sources) that
enter the system boundary. Secondly, the functional blocks represent the
functions within the system boundary. Thirdly, the outputs (e.g., materials,
energy, signals) that leave the boundary.
Additionally,
arrows illustrate the flow of materials, energy, signals, etc., between
functional blocks and into and out of the system. Each block within the
boundary corresponds to a primary or secondary function that must be provided
to transform the inputs into outputs. Therefore, every function block and its
associated outputs signify a function that must be furnished for the system to
operate correctly.
Each
function must be documented as a function statement consisting of a verb, an
object, and a performance standard To
ensure clear identification and definition. The performance standard should
specify the minimum acceptable requirement rather than the design capability
and must be clearly defined or quantified. It defines failure as the basis for
the maintenance decision-making process. Functions can be categorised as
primary or secondary. Primary functions represent the fundamental reasons why
the system/equipment exists. For instance, the primary functions of a diesel
engine are to provide power to drive the propeller from 0 to 91 RPM with output
from 0 to 16,860 kW. The minimum acceptable output is 9,000 kW to maintain a
minimum vessel speed of 7 knots. Secondary functions are generally less evident
but may have worse consequences if they fail. The following functional
categories can be used to determine secondary functions:
•
Environment integrity
•
Safety, structural integrity
•
Control, containment, comfort
•
Appearance
•
Protection
•
Economy, efficiency
•
Supplementary functions
For
example, some of the secondary functions of a diesel engine could include having
acceptable engine emissions by some standards and having a vibration level that
will not affect structural integrity.

Protection
and protective devices are the most critical of the various secondary functions.
These devices function in one of the following five ways:
•
Alerting the operator to abnormal
conditions
•
Shutting down the equipment when a
failure occurs
•
Eliminating or relieving abnormal
conditions following a failure that could otherwise cause more severe damage
•
Taking over from a failed function
•
Preventing a hazardous situation from
occurring in the first place
When
documenting the functions of any system/equipment, it is essential to list the
functions of all associated protective devices. These devices must receive
special attention as they safeguard the system/equipment and personnel.
2.6.3.4.2 IDENTIFYING FUNCTIONAL FAILURES FOR A FUNCTIONAL GROUP
Identifying
a series of functional failures is crucial for every function within the
functional group. Typically, each function will have at least two functional
failures, which can be a complete or partial loss of function. Deviations in
the performance standard usually represent a partial loss of function. For
instance, the function "to provide 16,860 kW at 91 RPM to the
propeller" can have the following functional failures:
•
Total loss of
function
No power to the propeller
•
Partial loss of
function
Provides less than 16,860 horsepower to the propeller
Provides more than 16,860 horsepower to the propeller
Provides less than 35 RPM to the propeller
Provides more than 91 RPM to the propeller
Functional
failures can be identified from functions by using the following guides:
•
No or none of the function
•
Less of each standard performance
parameter
•
More of each performance parameter
•
Premature operation of the function
•
Failure to cease operation of the
function (e.g., the function operates too long)
•
Intermittent operation of the function
•
Other functional failures appropriate for
the functional group
Each
functional failure must be documented in a statement
containing a verb, an object, and the functional deviation.
Function and Functional Failure List - Example

2.6.3.5 FMECA –
CONDUCTION
•
When a failure management strategy is
required
•
What type of failure management strategy
is best suited to manage the failure mode (e.g., one-time change, planned
maintenance, or run-to-failure)
•
The significance of the failure
management strategy
By evaluating the criticality of the failure
modes and their potential impact on the system/equipment, it is possible to
determine the most appropriate course of action to manage the failure. The
failure management strategy can include various approaches, such as redesign,
replacement, or modification of equipment, scheduled maintenance, or
run-to-failure. The importance of the failure management strategy will depend
on the consequences of the failure mode and the criticality of the
system/equipment.
2.6.3.5.1 IDENTIFYING FAILURE MODES AND EFFECTS WITH AN FMECA
There
are two primary approaches for performing an FMECA: bottom-up and top-down. Both methods can be effectively used in an RCM analysis, and each
has advantages and disadvantages. However, the main attribute of both
approaches is that they are inductive analysis techniques that help guide the
RCM analysis team in establishing the cause-and-effect relationships necessary
to identify maintenance requirements and other potential improvements.
The
bottom-up approach involves analysing individual equipment components and their
potential failure modes and effects, then evaluating their criticality in the
overall system/equipment context. This approach can be more time-consuming but
provides a more comprehensive understanding of the system/equipment's failure
modes.
On the
other hand, the top-down approach focuses on analysing the overall
system/equipment and its functions to identify potential failure modes and
their effects. This approach can be less time-consuming but may overlook some
equipment-specific failure modes.
Both
approaches can effectively identify potential failure modes and their impacts
on the system/equipment. They ultimately help develop a maintenance strategy that
maximises system/equipment reliability while minimising maintenance costs.
2.6.3.5.1.1
BOTTOM-UP FMECA APPROACH
The
bottom-up approach is a systematic method of explicitly analysing each equipment item. This approach focuses on understanding the effects of different
equipment failure modes on the system's operation. The bottom-up approach
involves determining whether an equipment failure mode results in a local
effect that leads to a functional failure, which ultimately causes an end
effect of interest. The following are the steps involved in performing a
bottom-up FMECA:
•
Select an equipment item for analysis
•
Identify potential failure modes for the
equipment item
•
Choose a failure mode for evaluation
•
Determine the failure characteristic
(e.g., wear-in, random, wear-out) for the failure mode
•
Determine the local, next higher-level,
and end effects for the postulated failure mode
•
If the end effect leads to a consequence
of interest, determine the causes of the failure mode
•
Use the risk decision tool to determine
the criticality of the failure mode
•
Repeat the steps as necessary until all
equipment items and associated failure modes have been evaluated
When
conducting a bottom-up FMECA, the failure causes are the fundamental equipment
failures that result in the failure mode, and the following higher-level effect
usually identifies the resulting functional failure.
The
bottom-up approach is advantageous because it helps ensure that all equipment
items are analysed, and all potential equipment failure modes are considered.
Furthermore, a standard list of failure modes can be created for common
equipment items, making the analysis more straightforward and promoting
consistency between RCM teams. This consistency allows for the efficient
transfer of knowledge and experience from one team to another, making it easier
for organisations to implement RCM strategies across multiple sites or
locations. Additionally, the bottom-up approach helps identify failure modes
specific to particular equipment items, which might be missed in a more general
top-down analysis. This detailed analysis can lead to the development of more
effective maintenance strategies and increase the reliability and safety of the
system/equipment.
2.6.3.5.1.2
TOP-DOWN FMECA APPROACH
The
top-down approach is a method of analysing each function and its associated
functional failures. This approach focuses on understanding the effects of
different functional failures on the system's operation and then identifying
which equipment failures (e.g., failure mode) can cause the functional failure.
The top-down approach aims to determine whether a functional failure results in
an end effect of interest and then determine which equipment failures can cause
the functional failure. The following are the steps involved in performing a
top-down FMECA:
•
Select a function for analysis
•
Choose a functional failure for
evaluation
•
Determine the local and end effects of
the postulated functional failure
•
If the end effect leads to a consequence
of interest, identify the equipment failures that can result in the functional
failure
•
Determine the failure characteristic
(e.g., wear-in, random, wear-out) for the failure mode
•
Use the risk decision tool to determine
the criticality of the failure mode
•
Repeat the steps until all functions and
functional failures are evaluated
The
top-down approach allows for a broader understanding of the system/equipment by
analysing the functions and associated functional failures, leading to a better
understanding of the system's overall reliability and safety. It is
advantageous for complex systems/equipment where many functions and multiple
pieces of equipment could fail. However, it is possible to overlook
equipment-specific failure modes that might only affect a single component or
subsystem, which could be identified more easily through a bottom-up approach.


Bottom-up FMECA Worksheet - Example

Top-down FMECA Worksheet - Example
2.6.3.5.2 CONSIDERATIONS IN IDENTIFYING FAILURE MODES AND FAILURE
EFFECTS WITH AN FMECA
Regardless
of whether a top-down or bottom-up FMECA approach is used, the FMECA must
identify equipment failures that can lead to functional failures, which
ultimately result in end effects of interest. To ensure that the FMECA serves
its intended purpose, the following issues must be considered:
2.6.3.5.2.1 IDENTIFYING FAILURE MODES
To develop a comprehensive list of failure modes
causing each functional failure, the following should be considered:
•
Failures that have previously occurred on
similar equipment
•
Other failure modes that are considered
probable, including those being suppressed by the current preventative
maintenance program
•
Failure modes that are possible but
considered unlikely are included to demonstrate that they have been considered
When conducting a bottom-up FMECA, the following
guide phrases may help develop a list of failure modes to consider:
•
Premature operation
•
Failure to operate at a designated time
•
Intermittent operation
•
Failure to stop operation at a designated
time
•
Loss of output or failure during
operation
•
Degraded output or operational capability
•
Other unique failure conditions
The causes of failure, such as normal wear and
tear, corrosion, abrasion, erosion, fatigue, etc., should be recorded in detail
to identify an appropriate failure management strategy. In addition, if there
is clear evidence of human error leading to failures or if operator error can
cause significant consequences, those failures should also be included. It is
essential to ensure that the causes of failure are adequately identified so
that the subsequent maintenance recommendations address the root cause rather
than just treating its symptoms.
2.6.3.5.2.2
IDENTIFYING FAILURE EFFECTS
When
identifying failure effects, it is crucial to consider the following three
levels:
•
Local effects: These are effects that are
localised to the system/equipment being analysed and should include the
following:
o
Methods of detecting failures (e.g.,
alarms, test indicators)
o
Reduced level of performance
o
Whether a standby system/equipment can
provide the same function
•
Next higher effects: These are effects on
the larger system to which the system/equipment belongs and should include the
following:
o
Potential physical damage to the
system/equipment
o
Potential secondary damage to other
equipment in the system or unrelated equipment in the vicinity
•
End effects: These are effects on the
vessel and should include the following:
o
Threats to safety and the environment
o
The operational effectiveness of the
vessel
o
Downtime required to repair the damage
2.6.3.5.3 END EFFECT CONSIDERATIONS
Upon
identifying the end effects of failure, the following information should be
included in the FMECA:
•
Mitigation strategies to reduce the
consequences of failure before implementing maintenance (e.g., activating a
standby system, reconfiguring the system), and the estimated time needed for
such action
•
Repair action for the defective item
(e.g., repairing primary and secondary damages, identifying personnel needed,
determining if dry-docking or shore support is necessary, estimating the time
required for the repair)
•
Identification of spare parts needed for
the repair
2.6.3.5.3.1
LEVEL OF INDENTURE CONSIDERATIONS
When
conducting FMECA for a functional group, it is usually performed at the level
of equipment where maintenance is performed. This level is known as the
convenient indenture level. However, a lower indenture level should be chosen
if more than 20 to 30 failure modes can be identified at this level. The lower
level should be selected to ensure comprehensive analysis and to identify all
potential failure modes that may affect the system's functionality. This
approach helps ensure that all potential failure modes are identified and
maintenance strategies can be developed to mitigate the risks associated with
those failure modes.
2.6.3.5.3.2
MAINTENANCE CONSIDERATIONS
When
conducting FMECA, it is important to assume zero-based maintenance, which means
that no proactive maintenance tasks are being performed. This approach is
necessary to identify the potential failure modes that could occur without any
maintenance and to determine the need for a failure management strategy. If
proactive maintenance tasks were included in the analysis, the risk associated with equipment failures could be underestimated.
However,
the probability of failure for existing maintenance programs should be based on
the current maintenance program; this allows for a more accurate assessment of
the equipment's actual risk of failure, considering the maintenance tasks
already being performed. This information can be used to optimise the
maintenance program and identify any additional maintenance tasks necessary to
mitigate the risks associated with equipment failures.
2.6.3.5.4 ASSESSING THE CRITICALITY OF FAILURE MODES AND EFFECTS IN AN
FMECA
Criticality analysis is an important step in the RCM process as it involves ranking each potential failure mode identified during the FMECA based on a combination of severity classification and probability of occurrence. This
analysis aims to identify the risks associated with each failure mode and
prioritise them based on their criticality level. By doing so, maintenance
resources can be allocated more effectively to those failure modes that pose
the most significant risk to the system's functionality, safety, and
environmental impact.
The
criticality analysis involves assigning a severity classification to each
potential failure mode based on the consequences of the failure and a
probability of occurrence based on the likelihood of the failure mode
occurring. Then, the severity and probability rankings are combined to
calculate a risk priority number (RPN) for each failure mode. The RPN is used
to prioritise the failure modes and identify those that require immediate
attention.
The
criticality analysis highlights the risks associated with each failure mode and
helps ensure that maintenance resources are allocated effectively to mitigate
those risks. This approach can help prevent costly equipment failures and
downtime, improve safety, and reduce environmental impact.
Two
approaches may be taken to determine the frequency category (probability of
occurrence) during the criticality analysis.
•
The first approach is the quantitative
approach, which should be used if reliability data is available. This approach
involves analysing the reliability data and calculating the probability of
occurrence of each potential failure mode. The source of the data and the
operating context should be noted to ensure the analysis is accurate and
reliable.
•
The second approach is the qualitative
approach, which is used when quantitative data is unavailable to determine the
probability of occurrence. This approach involves applying engineering judgment
based on previous experience; this may include expert opinions, historical
data, and other sources of information to estimate the probability of
occurrence of each potential failure mode. This approach may be less precise
than the quantitative approach, but it is still helpful in identifying and
ranking potential failure modes.
Regardless
of the approach used, it is important to ensure that the probability of
occurrence is accurately and consistently determined to ensure that the
criticality analysis is reliable and effective in identifying and prioritising
potential failure modes.
To
determine the qualitative risk associated with a failure mode, the following
procedure should be followed:
•
Severity classification: Identify the
consequence of the end effect resulting from each failure mode and the severity
category allocated in applying the example shown here. Suppose the failure mode does not directly result in an end effect. In that case, the criticality analysis will assume that
the protected function experiences failure with the protective device in the
failed state.
•
Probability of occurrence: Derive the
probability of occurrence of each failure mode identified in the FMECA. If
reliability data are available, use the quantitative approach to determine the
probability of occurrence. Otherwise, use engineering judgment based on
previous experience.
•
Risk matrix: Plot the severity
classification and probability of occurrence on the risk matrix shown here to
obtain the risk level.
The
criticality ranking or risk level for each failure mode/end effect pair is then
used in an RCM decision flow chart to determine the appropriate failure
management strategy. Examples of criticality ranking can be found here.
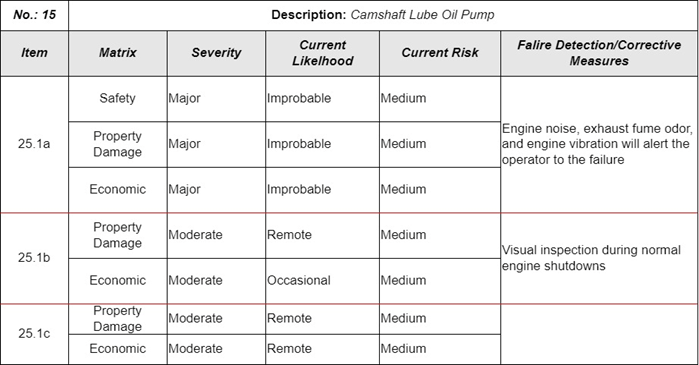
2.6.3.6 SELECTING A
FAILURE MANAGEMENT STRATEGY


After
conducting the FMECA, failure modes assessed to have high, medium or low risks
are evaluated using the RCM Task Selection Flow Diagrams at the level of each
system/equipment item. The flow diagram helps determine the appropriate failure
management strategy for the identified failure modes. An example of suggested
failure management tasks for the identified failure modes is provided. It
should be noted that the answers to the questions posed in the flow diagram only
apply to the operating mode under consideration, and "Normal Operating
Conditions" (NOC) should be interpreted as the normal operating condition
concerning the relevant operating mode.
2.6.3.6.1 RCM TASK SELECTION FLOW DIAGRAM
The RCM
Task Selection Flow Diagram helps determine each failure mode's most effective
and efficient failure management strategy based on its assessed risk. The flow
diagram considers the failure's consequences, the likelihood of occurrence, and
the effectiveness of the failure management strategy to select the appropriate
tasks to manage the identified failure modes.
2.6.3.6.1.1
FIRST SELECTION DECISION
To
determine whether a failure mode has the highest or lowest risk, the RCM
analysis team must consider the consequences and probability of occurrence
associated with each failure mode. If a failure mode has the highest risk and
cannot be managed through maintenance alone, a fundamental change in how the
equipment is designed or operated may be required. In this case, a one-time
change is necessary to reduce the risk. Once the one-time change is identified,
the FMECA should be updated, and any applicable failure modes should be
reevaluated using the RCM Task Selection Flow Diagram.
On the
other hand, if a failure mode has the lowest risk, it may not require any
failure management strategy. Therefore, the RCM analysis team should have a
high confidence level in the risk characterisation, indicating that the team is
relatively confident that the risk is characterised correctly and can be used
in the RCM flow diagram without further discussion.
However,
if the confidence level in the risk characterisation is low, indicating
uncertainty, the failure mode is assumed to have a medium/moderate risk
characterisation. The entire RCM Task Selection Flow Diagram evaluates the
failure management strategy. Additional data about the probability or
consequence of the failure may be needed before the risk can be used in the
decision-making process.
2.6.3.6.1.2
SECOND SELECTION DECISION
Condition-monitoring
tasks are considered first because they are usually the most technically
feasible and cost-effective option. To determine if a failure mode can be
managed through a condition-monitoring task, the team should select a specific
task and determine an appropriate task interval. The following criteria should
be considered when selecting the task:
•
The task must be practicable to implement
•
The task must have a high degree of
success in detecting the failure mode
•
The task must be cost-effective, meaning
that the cost of performing the task should be less than the total cost of the
consequences of failure over time.
The
team should then evaluate the potential risk reduction resulting from
implementing the condition-monitoring task by comparing the reduced risk to the
risk acceptance criteria. Suppose the risk reduction achieved by the task is unacceptable. Further analysis is needed to determine if other maintenance tasks
or a one-time change is needed to manage the failure.
Proactive maintenance task intervals should ideally be based on actual failure data to determine the task interval, but this may not be feasible for most
organisations. Therefore, the task interval can be determined from the
following sources in ascending order of priority:
•
Generic P-F interval data
•
Manufacturer's recommendations
•
Current task intervals
•
Team experience
For
condition-monitoring tasks, the task interval must be set at less than half the
anticipated P-F interval to ensure enough warning time to take
action and avoid the consequences of failure.
2.6.3.6.1.3
THIRD SELECTION DECISION
For
wear-out failure modes, the team must select a planned maintenance task that
will restore the equipment item to an acceptable level of performance before it
fails. The task and task interval should be determined based on the following
criteria:
•
The task should effectively reduce the probability of the failure mode occurring.
•
The task should be practical to implement
and cost-effective.
•
The task interval should be based on the
anticipated P-F interval and the consequences of failure.
•
The task interval should be less
than half the anticipated P-F interval.
Suppose the selected planned maintenance task does not achieve an acceptable level of risk reduction. In that case, the team must evaluate the need for additional or alternative
maintenance tasks or a one-time change.
a) MAINTENANCE TASK
SELECTION CRITERIA
If the
risk reduction achieved through the planned maintenance task is unacceptable,
the team must evaluate the need for design or operational changes to manage the
failure mode. For example, if the failure mode exhibits a wear-out failure
characteristic, a one-time change or redesign of the equipment item may be
necessary to manage the failure. If the failure mode exhibits a wear-in failure
characteristic, a one-time change or redesign may also be necessary, but the
team should evaluate whether any other proactive maintenance tasks can be
implemented in addition to the one-time change or redesign.
b) MAINTENANCE
TASK INTERVAL DETERMINATION.
Ideally,
proactive maintenance task intervals are determined using actual failure data,
but this is not realistic for most organisations. Therefore, the task frequency
must be determined from the following sources listed in ascending order of
priority and documented:
•
Generic failure data
•
Manufacturers' recommendations or failure
data
•
Current task intervals
•
Team experience
For
planned maintenance to be effective, the item must have a straightforward life. Most items must survive this life, after which the conditional
probability of failure increases significantly. The life can be determined
based on information from the equipment manufacturer, expert opinion, published
reliability data, actuarial analysis, etc.
Suppose the risk reduction does not achieve an acceptable level of risk. In that case, the failure mode
is further analysed to determine if a combination of planned maintenance and
condition-monitoring tasks can achieve an acceptable risk. If a combination provides
an appropriate failure management strategy, the failure mode is further
analysed per the maintenance task selection criteria above.
2.6.3.6.1.4
FOURTH SELECTION DECISION
The
failure-finding task is a proactive maintenance task designed to detect
hidden failures. It is used when condition monitoring and planned maintenance
tasks are insufficient to manage the risk associated with a hidden failure
mode. The following criteria should be considered when selecting a
failure-finding task:
•
The failure-finding task must be
practicable to implement.
•
The task must have a high degree of
success in detecting the hidden failure mode.
•
The cost of undertaking the task over some time should be less than the total cost of the consequences of
failure.
•
The task interval must give enough
warning of the failure to ensure action can be taken in time to avoid the
consequences.
If a
failure-finding task is selected, the task and interval should be recorded in
the maintenance program, and the failure mode should be reassessed using the
RCM Task Selection Flow Diagram to ensure that the selected task provides an
acceptable level of risk.
a) MAINTENANCE
TASK SELECTION CRITERIA
If the
failure-finding task is an appropriate failure management strategy,
the team must select the task and task interval. The task interval for a
failure-finding task must give enough time for the hidden failure mode to
develop between inspections while providing enough warning time to take
appropriate corrective action. The maintenance task interval must be set at
less than half the anticipated time between the failure of the protective
device and the secondary failure. Suppose the risk reduction achieved by the failure-finding task does not achieve an acceptable level of risk. In that case, the failure
mode is further analysed to determine if a one-time change or redesign of the
equipment item is needed to manage the failure.
(b)MAINTENANCE
TASK INTERVAL DETERMINATION
In an
ideal scenario, actual failure data should be used to determine the intervals
for proactive maintenance tasks. However, for most organisations, this is not
feasible. Hence, the frequency for these tasks must be established based on the
following sources, in order of priority, and documented:
•
Generic failure data
•
Manufacturers' recommendations or failure
data
•
Current task intervals
•
Team experience
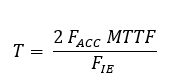
Availability
and reliability information should be utilised wherever possible to set the
failure-finding intervals T. One equation that can be used to determine T is as
follows:
The
team should consider regulatory requirements and guidelines when setting the
unavailability limits for different functions. As a general guide, the
unavailability for safety and environmental functions should be kept as low as
reasonably practicable, typically not exceeding 0.05%. The unavailability limit
should be kept below 2.0% for operational functions, while for non-operational
functions, the limit may be higher, up to 10%.
2.6.3.6.1.5
ONE-TIME CHANGES
If the
team determines that a one-time change is the best failure management strategy,
the team should update the FMECA and RCM Task Selection Flow Diagram to include
the change. The team should also consider any impact the change may have on
other systems, equipment, or processes and ensure that any necessary
modifications are made.
Suppose the team determines that none of the maintenance tasks or one-time changes can manage the failure to an acceptable level of risk. In that case, the team must record the
failure mode and its associated risks in the system/equipment documentation and
notify the appropriate personnel. The risk may need to be reevaluated
periodically or when new information becomes available.
It
should be noted that the RCM process is ongoing and requires
continuous monitoring and feedback. As new data becomes available or the
operating context changes, the FMECA and RCM Task Selection Flow Diagram should
be updated accordingly.
2.6.3.6.1.6
ROUNDS AND ROUTINE SERVICING
The
team should also review rounds and routine inspection tasks to prevent altering
the failure rate curve for the failure mode. These tasks are essential to
maintaining the basis for proactive maintenance tasks and risk characterisation,
preventing issues such as premature wear-out of a bearing due to insufficient
lubrication.
2.6.3.6.2 MAINTENANCE TASK ALLOCATION AND PLANNING
2.6.3.6.2.1
TASK CATEGORIES
The
RCM-derived maintenance tasks should be categorised as follows:
•
Category A: Can be performed by the
vessel's crew while at sea.
•
Category B: Must be carried out alongside
with the assistance of equipment vendors or using dockside facilities.
•
Category C: Must be performed in a dry
dock facility.
2.6.3.6.2.2
TASK INTERVAL ADJUSTMENT
The
task intervals resulting from the RCM analysis may not align with the current calendar-based
maintenance schedule, so the team must integrate them into a common maintenance
schedule. However, the RCM task intervals may need to be adjusted to a shorter
or longer interval depending on the following criteria:
•
Tasks with safety or environmental
consequences should only be adjusted to a shorter task interval to ensure that
safety and containment are not compromised.
•
Tasks with operational consequences may
be adjusted to a longer or shorter task interval. However, if the interval is adjusted to a longer one, the responsible person in the shipping company should approve
the change.
2.6.3.6.2.3
OVERALL MAINTENANCE SCHEDULE
Category
B and C tasks should be organised to derive an overall maintenance schedule by
adjusting the RCM task intervals, but only for Category B and C tasks. This
adjustment should be made using the criteria specified in Category B so that
these tasks can be timed to coincide with the vessel's port calling and
dry-docking schedules.
2.6.3.6.3 SPARES HOLDING
The
availability of spares to support the identified maintenance tasks is crucial
for the proposed maintenance schedules to be viable. The spare holding
requirement should be developed based on the following factors:
•
The list of parts needed to perform tasks
to correct each failure mode identified in the RCM analysis and the parts
required as a result of remedial work to correct condition-monitoring, planned maintenance,
failure-finding, any applicable and effective, and run-to-failure tasks.
•
An assessment of the impact on the
operational availability of the functional group or system in an out-of-stock
situation.
•
An evaluation of the parts that can be
preplanned for use. For parts that cannot be preplanned, determine the quantity
required to achieve the desired operational availability.
2.6.3.6.3.1
STOCK-OUT EFFECT ON END EFFECTS
Determine
whether the stock-out and further failure will result in End Effects, such as
degradation or loss of propulsion, fire, etc. When determining the effect,
consider the direct and indirect effects of the stock-out under normal
circumstances. The following defines direct and indirect effects and normal
circumstances.
•
Direct effect. Suppose the spare is unavailable, and the associated maintenance tasks cannot be carried out. In that case, the corresponding
failure mode will eventually lead to an End Effect(s) if a failure occurs.
•
Indirect effect. Suppose the spare is unavailable, and the associated maintenance tasks cannot be carried out. In that case, the corresponding
failure mode will not lead to an End Effect(s) unless a different failure
occurs.
•
Normal circumstances. The item operates within the context without a failure occurring.
•
If the stock-out has no effect, then no
spare holding is required.
2.6.3.6.3.2
SPARES HOLDING DECISIONS
The
spares selection process involves the following decision-making process when a
stock-out or a stock-out and further failure may result in End Effects:
•
If parts requirements can be anticipated
before failure occurs or there is sufficient warning time for parts to be
ordered, order parts before demand occurs, provided that ordering parts in
advance is acceptable.
•
If ordering parts in advance is not
acceptable, consider holding parts onboard or in storage depots, provided that:
o
The risk of a stock-out is reduced to an
acceptable level.
o
The cost and storage basis for holding
the parts are feasible.
•
If neither of the above strategies is
feasible, consider the following:
o
If the stock-out will result in End
Effect(s) (direct or indirect), reviewing the RCM analysis to revise the
maintenance task is mandatory.
o
If the stock-out will only have a
non-operational effect, reviewing the RCM analysis to revise the maintenance
task is desirable.


FIGURE 6 Spares Holding
Decision Flow Diagram (1)
An example of an operating context and analysis is the fuel oil piping
system with two fuel oil supply pumps arranged in parallel redundancy. The
system is designed to supply heavy fuel oil to the main propulsion engine and
two diesel generator engines operating at their maximum continuous rating. The
pumps are operated alternately, with one pump operating for a week while the
other is on standby. The anticipated annual service hours for both pumps are
the same. This operating context and analysis provide the necessary information
to develop a maintenance strategy to ensure the system's reliability and
availability.

http://www.atpm.co.kr/5.mem.service/6.data.room/data/treatise/5.reliability/5.reliability_01.pdf
Disclaimer:
Out of Box Maritime Thinker © by Naro
Consilium Group 2022 and Aleksandar Pudar assumes no responsibility or
liability for any errors or omissions in the content of this paper. The
information in this paper is provided on an "as is" basis with no
guarantees of completeness, accuracy, usefulness, or timeliness or of the
results obtained from using this information. The ideas and strategies should
never be used without first assessing your company's situation or system or
consulting a consultancy professional. The content of this paper is intended to
be used and must be used for informational purposes only.


